Note
Go to the end to download the full example code. or to run this example in your browser via Binder
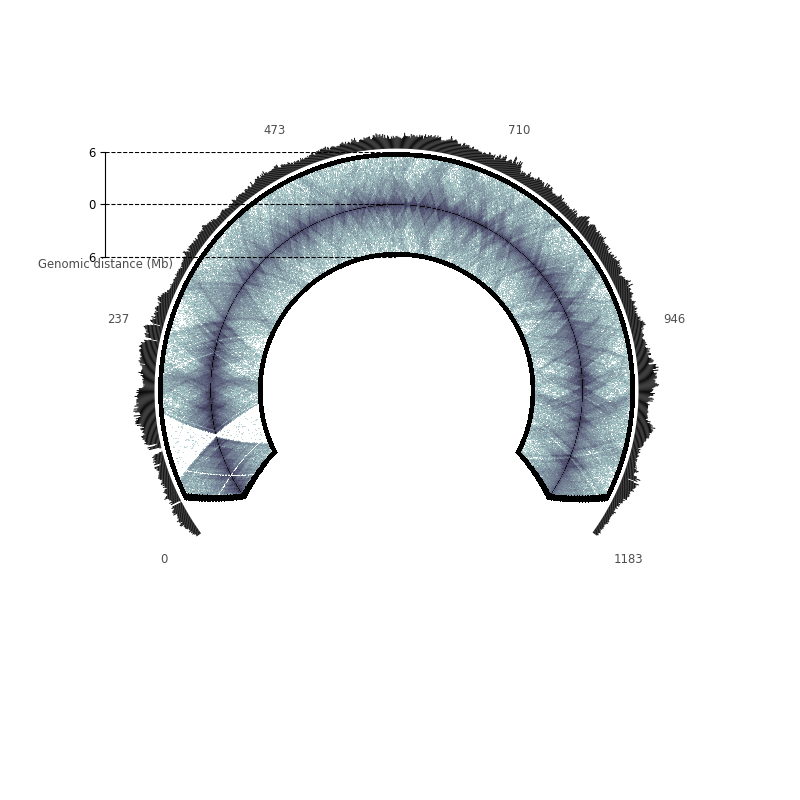
A human chromosome: KBM7’s chr11
Here, we plot the raw contact counts of KBM7’s chromosome 11, and the cumulative raw contact counts.

Text(0, 0.5, 'Genomic distance (Mb)')
from circhic import CircHiCFigure, datasets

data = datasets.load_kbm7()
counts = data["counts"]
lengths = data["nbins"]

cum_raw_counts = counts.sum(axis=1)

circfig = CircHiCFigure(lengths, chromosome_type="linear")
circfig.plot_hic(counts, inner_radius=0.5, outer_radius=0.89, cmap="bone_r",
                 inner_gdis=80, outer_gdis=80)
_, ax = circfig.plot_bars(
    cum_raw_counts,
    inner_radius=0.9,
    outer_radius=0.99,
    color="0")
circfig.set_genomic_ticklabels(
    fontdict={"fontsize": "small", "color": "0.3"})

rax = circfig.plot_raxis()
rax.set_yticklabels(["6", "0", "6"], fontsize="small")

rax.set_ylabel("Genomic distance (Mb)", fontsize="small", color="0.3",
               position=(0, 1.03))
Total running time of the script: (0 minutes 5.437 seconds)