circhic.CircHiCFigure
- class circhic.CircHiCFigure(lengths, origin=1, chromosome_type='circular', figure=None)
A circular HiC figure
- Parameters:
- lengths : ndarray
array of chromosome length.
- origininteger, optional, default: 1
position of the origin. The origin is set to the North of the plot
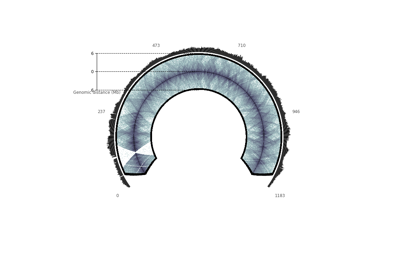
- chromosome_type{“circular”, “linear”}, optional, default: “circular”
whether to plot a circular or a linear chromosome.
- figure : matplotlib.figure.Figure, optional, default: None
A Matplotlib figure. If not provided, will create it.
Notes
See FIXME
Methods
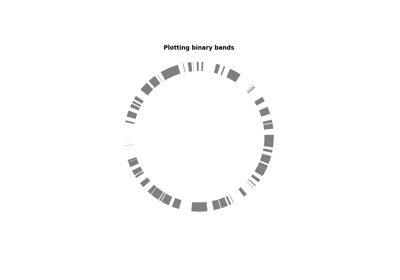
plot_bands(begin, end[, colors, ...])Plot bands
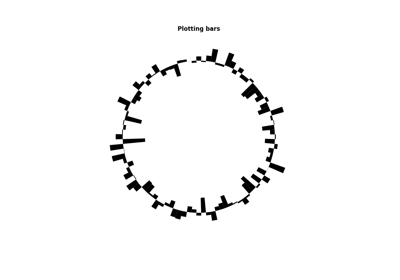
plot_bars(data[, color, inner_radius, ...])Plot a bar chart
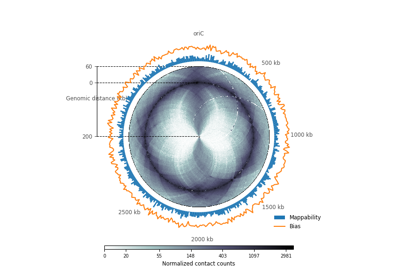
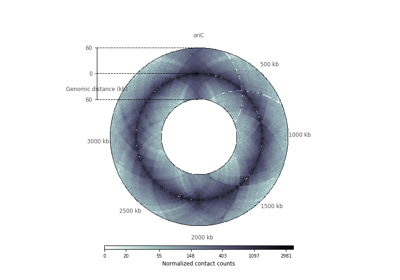
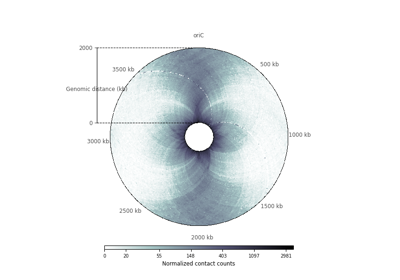
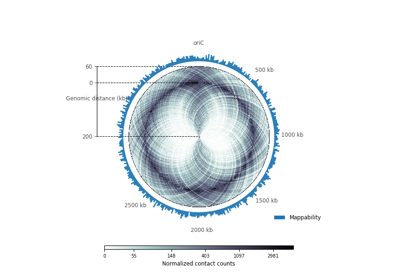
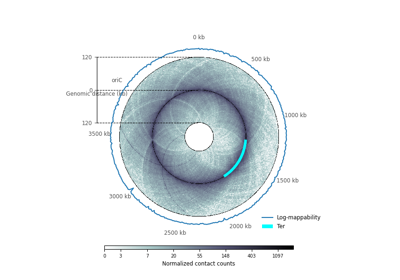
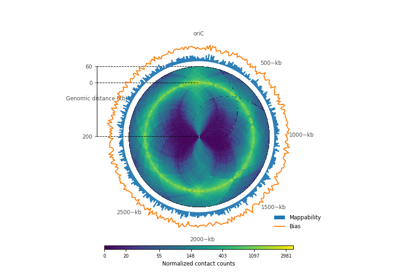
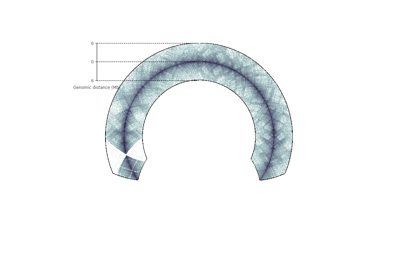
plot_hic(counts[, inner_gdis, outer_gdis, ...])Plot a heatmap of the HiC contact count matrix on a circular strip.
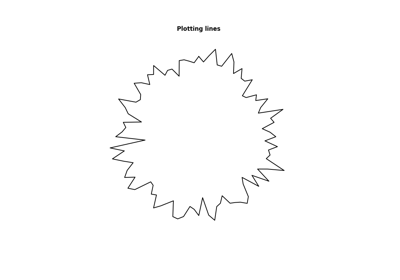
plot_lines(data[, color, linestyle, ...])Plot a line chart
Plot the r-axis, corresponding to the genomic distance
set_colorbar(mappable[, orientation, ...])Set a colorbar on the plot
set_genomic_ticklabels([outer_radius, ...])Set the circular tick labels
- __init__(lengths, origin=1, chromosome_type='circular', figure=None)
- plot_bands(begin, end, colors=None, inner_radius=0, outer_radius=1)
Plot bands
- Parameters:
- beginndarray (l, )
List of the all the beginnings of each band.
- endndarray (l, )
List of all the ends of each band.
- colorsndarray (l, )
List of colors. Should be the same size as begin and end
- Returns:
- (artists, ax)
- plot_bars(data, color=None, inner_radius=0, outer_radius=1, zorder=None)
Plot a bar chart
- Parameters:
- datandarray (n, )
- colora compatible matplotlib color, optional, default: None
The line color. Possible values:
A single color format string (e.g. “#000000”, “black”, “0”).
A float between 0 and 1
Defaults to None.
- linestylea compatible Matplotlib linestyle, optional, default: None
- inner_radius : float (0, 1), optional, default: 0
The inner radius of the plot, assuming the maximum outer radius possible is 1. Should be smaller than outer_radius.
- outer_radius : float (0, 1), optional, default: 1
The outer radius of the plot, assuming the maximum outer radius possible is 1. Should be larger than inner_radius.
- zorderfloat
- Returns:
- (artists, ax)
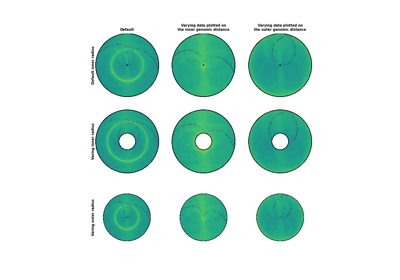
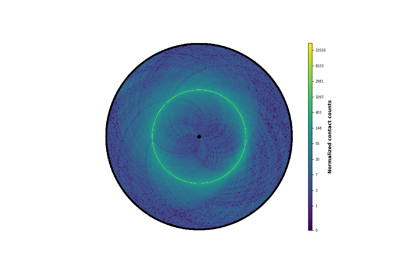
- plot_hic(counts, inner_gdis=None, outer_gdis=None, inner_radius=0, outer_radius=1, resolution=1, cmap='viridis', mode='reflect', vmin=None, vmax=None, alpha=1, border_thickness=0.02, ax=None, granularity=0.5)
Plot a heatmap of the HiC contact count matrix on a circular strip.
- Parameters:
- counts : ndarray (n, n)
The contact count matrix of shape (n, n) where n = lengths.sum() / resolution
- inner_gdisinteger, optional, default: None
Plot up to inner_gdis of the diagonal of the contact count matrix (in genomic distance). Corresponds to the lower-diagonal on a typical square HiC contact count matrix.
- outer_gdisinteger, optional, default: None
Plot up to outer_gdis of the diagonal of the contact count matrix (in genomic distance). Corresponds to the upper-diagonal part of the contact count matrix on a typical square contact count map.
- inner_radius : float, optional, default: 0
Radius of the inner strip, considering that the maximum outer radius is 1. Should be smaller than outer_radius. Note that inner_radius will be ignored if ax is provided.
- outer_radiusfloat, optional, default: 1
Radius of the outer strip, considering that the maximum possible outer radius is 1. Should be larger than inner_radius.
- resolution : integer, optional, default: None
Resolution of the HiC contact count map. By default, the function will estimate the resolution given the lengths of the chromosome and the shape of the contact count matrix.
- cmapstring, optional, default“viridis”
A Matplotlib colormap.
- mode{“reflect”, “distant”}, optional, default: “reflect”
if “reflect”, the contact count matrix will be plotted from inner_gdis to 0, then 0 to outer_gdis.
if “distant”, the contact count matrix will be plotted from inner_gdis to outer_gdis: this option is useful to visualize contact counts far away from the diagonal.
- vmin, vmaxfloat, optional, default: None
vmin and vmax define the data range that the colormap covers. By default, the colormap covers the complete value range of the supplied data.
- axmatplotlib.axes.Axes object, optional, default: None
Matplotlib Axes object. By default, will create one. Note that outer_radius and inner_radius will be ignored if ax is provided.
- Returns:
- (im, ax) type of artist and axes
- plot_lines(data, color=None, linestyle=None, inner_radius=0, outer_radius=1, zorder=None)
Plot a line chart
- Parameters:
- datandarray (n, )
- colora compatible matplotlib color, optional, default: None
The line color. Possible values:
A single color format string (e.g. “#000000”, “black”, “0”).
A float between 0 and 1
Defaults to None.
- linestylea compatible Matplotlib linestyle, optional, default: None
- inner_radius : float (0, 1), optional, default: 0
The inner radius of the plot, assuming the maximum outer radius possible is 1. Should be smaller than outer_radius.
- outer_radius : float (0, 1), optional, default: 1
The outer radius of the plot, assuming the maximum outer radius possible is 1. Should be larger than inner_radius.
- zorderfloat
- Returns:
- (lines, ax)
- plot_raxis()
Plot the r-axis, corresponding to the genomic distance
- set_colorbar(mappable, orientation='vertical', tick_formatter=None)
Set a colorbar on the plot
- Parameters:
- mappable : matplotlib.cm.ScalarMappable
The matplotlib.cm.ScalarMappable (i.e., Image, ContourSet, etc.) described by this colorbar.
- orientation{“vertical”, “horizontal”}, default: “vertical”
Whether to plot a vertical or horizontal colorbar.
- set_genomic_ticklabels(outer_radius=1, ticklabels=None, tickpositions=None, fontdict=None, ax=None)
Set the circular tick labels
- Parameters:
- ticklabelsarray-like of strings
the list of strings to plot. Should be the same length as the number of ticks.
- tickpositionsarray of floats
the positions of the ticks. Should be the same length as the tick labels.
- fontdict : dict, optional
A dictionary controlling the appearance of the ticklabels. The default fontdict is:
- {‘fontsize’: rcParams[‘axes.titlesize’],
‘fontweight’: rcParams[‘axes.titleweight’], ‘verticalalignment’: ‘baseline’, ‘horizontalalignment’: loc}
See the Maplotlib documentation for more information on the fontdict.
- axmatplotlib.axes.Axes object, optional, default: None
Matplotlib Axes object. By default, will create one. Note that outer_radius and inner_radius will be ignored if ax is provided.