Note
Go to the end to download the full example code. or to run this example in your browser via Binder
Plotting lines
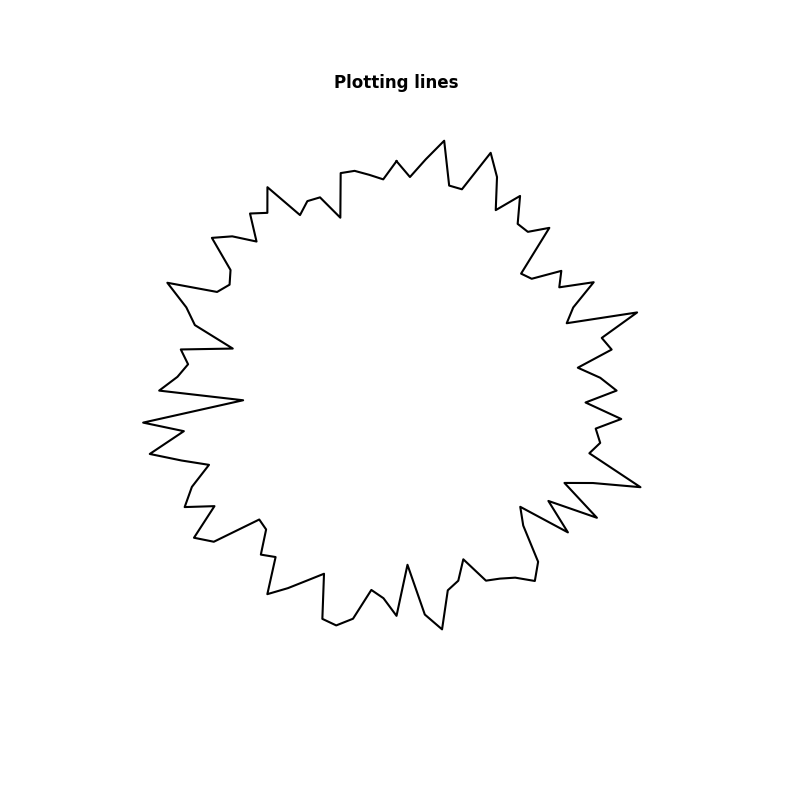
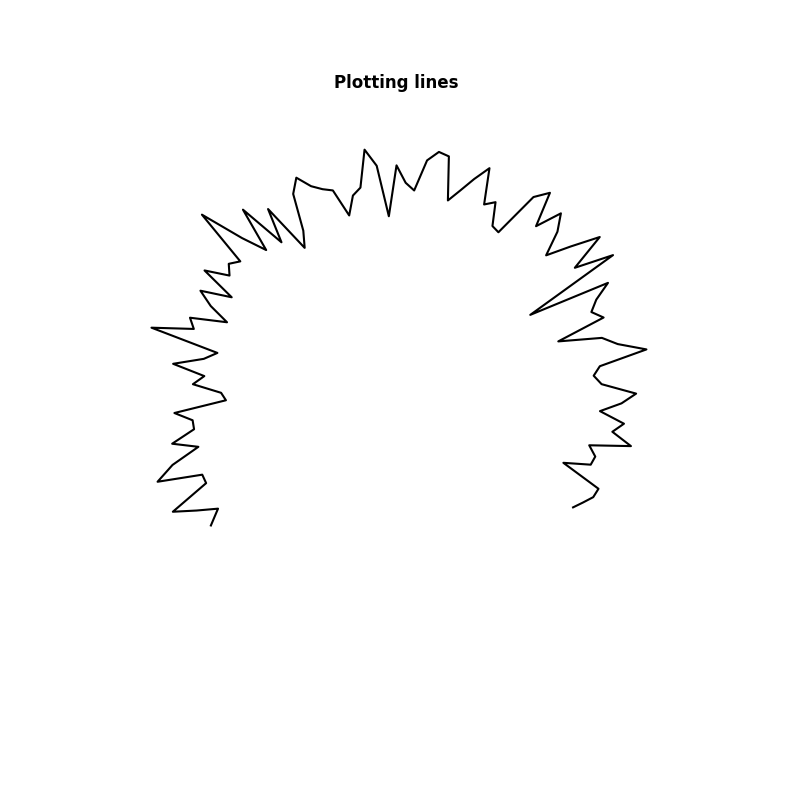
Here’s a small example showcasing how to plot lines on a circular strip. The first example showcases line plots on circular chromosome, while the second showcases plots on a linear chromosome.
import numpy as np
from circhic._base import CircHiCFigure
First, simulate some data
lengths = np.array([3500])
random_state = np.random.RandomState(42)
data = random_state.randn(100)
Then, create the circhic figure and plot the lines.
circhicfig = CircHiCFigure(lengths)
_, ax = circhicfig.plot_lines(
    data,
    inner_radius=0.5,
    color="0")
ax.set_title("Plotting lines", fontweight="bold")
Text(0.5, 1.0493697602799101, 'Plotting lines')
Now create a circhic figure for linear chromosomes
circhicfig = CircHiCFigure(lengths, chromosome_type="linear")
_, ax = circhicfig.plot_lines(
    data,
    inner_radius=0.5,
    color="0")
ax.set_title("Plotting lines", fontweight="bold")
Text(0.5, 1.0493697602799101, 'Plotting lines')
Total running time of the script: (0 minutes 0.185 seconds)