Color sector residues on 3D structure in Pymol
This example shows how to color a set of residues on a 3D protein structure based on their contribution to the independent component of the sector that is considered using the Pymol software.
Pymol should be installed on your computer.
Open the PDB in Pymol
After performing your coevolution analysis such as in the example plot_full_SCA_analysis.py, you should have a .npy object with the positions of the residues corresponding to a given sector mapped on the sequence of your reference PDB file.
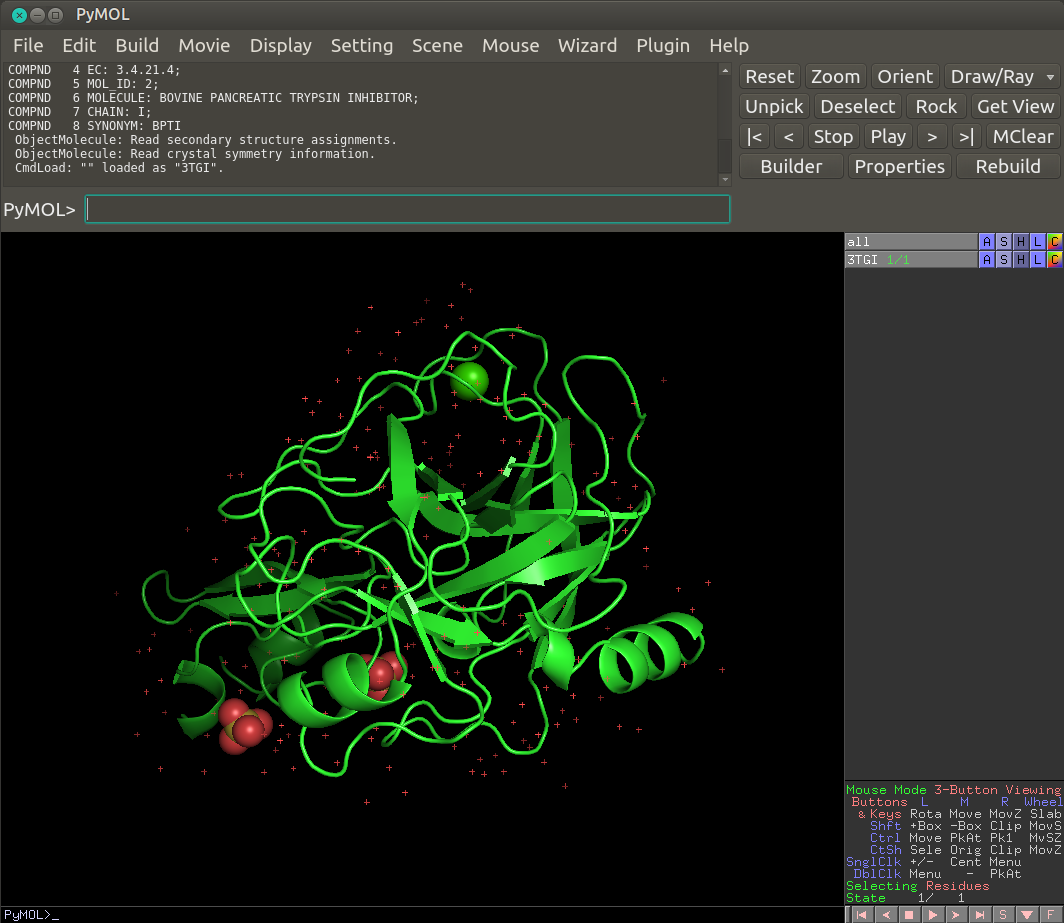
In the case of the S1A serine proteases, we use the rat’s trypsin PDB 3TGI.pdb.
Open a Pymol window, then click on ‘file’ -> ‘open’ and select the PDB file that is locally present on your computer.
Adapt Pymol code to your local path
Save the pymol code that is displayed below and modify it so that it works on your local environment :
change the path line 20 to your local path towards your numpy object
line 24, you can change the cmap parameter to any matplotlib’s colormap
Execute Pymol code
In Pymol’s terminal prompt, copy the following line with the appropriate path to your pymol code : @path_to_pymol_code
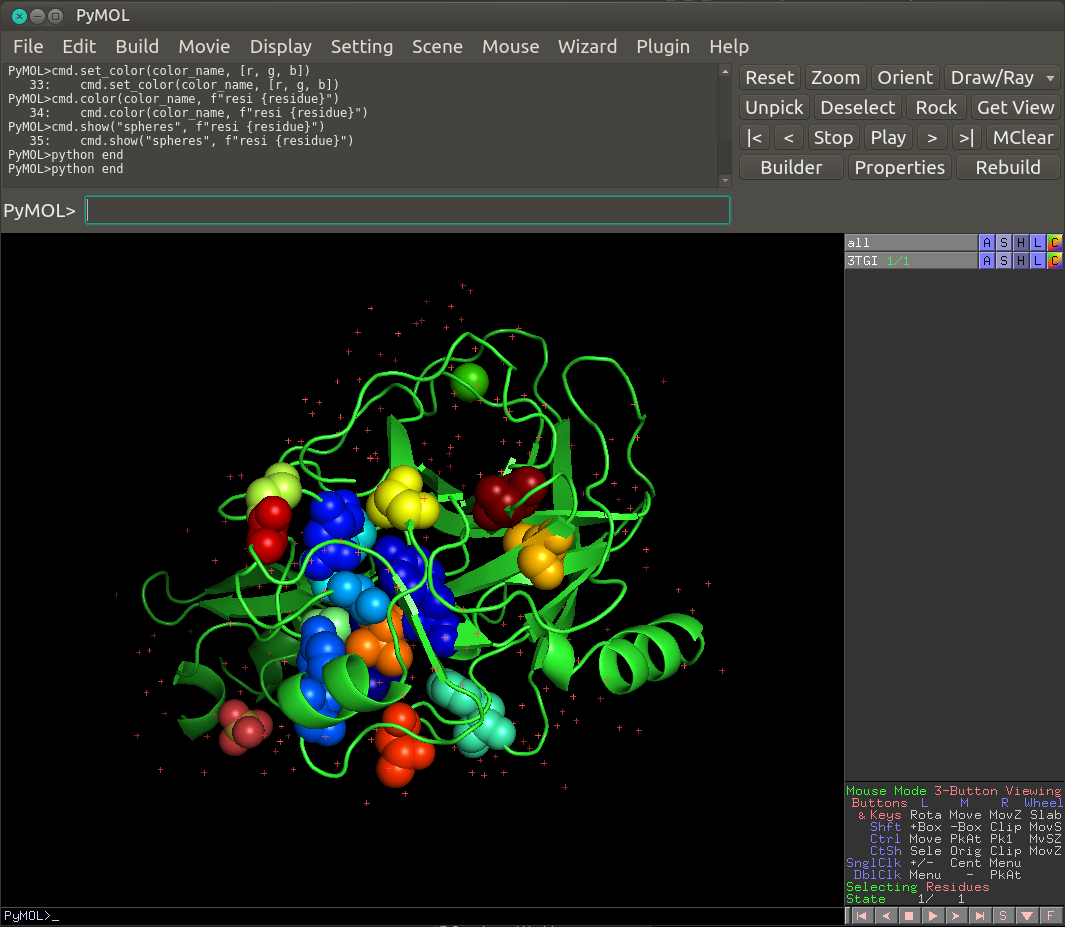
The sector residues should appear as colored spheres on the 3D protein structure such as in the following image.
Pymol code to save locally
 1python
 2import numpy as np
 3import matplotlib.colors as colors
 4import matplotlib.pyplot as plt
 5
 6
 7def _generate_colors_from_colormaps(n_colors, cmap="jet", as_hex=True):
 8    """
 9    Generate a list of n colors from colormap
10    """
11
12    colormap = plt.get_cmap(str(cmap))
13    indx = np.linspace(0, 1, n_colors)
14    indexed_colors = [colormap(i) for i in indx]
15    if as_hex:
16        indexed_colors = [colors.to_hex(i) for i in indexed_colors]
17    return indexed_colors
18
19
20residue_swap = list(np.load('your/path/to/color_sector_1_pymol.npy'))
21residue_pos = residue_swap[0].astype('int')
22
23nvals = len(residue_pos)
24colormap = _generate_colors_from_colormaps(nvals, cmap='jet', as_hex=False)
25
26for i in range(len(residue_pos)):
27    residue = residue_pos[i]
28    r = colormap[i][0]
29    g = colormap[i][1]
30    b = colormap[i][2]
31
32    color_name = f"residue_{residue}"
33    cmd.set_color(color_name, [r, g, b])
34    cmd.color(color_name, f"resi {residue}")
35    cmd.show("spheres", f"resi {residue}")
36python end