cocoatree.visualization.update_tree_ete3_and_return_style
- cocoatree.visualization.update_tree_ete3_and_return_style(tree_ete3, df_annot, xcor_id=None, xcor_seq=None, meta_data=None, show_leaf_name=True, fig_title='', linewidth=1, linecolor='#000000', bootstrap_style={}, tree_scale=200, metadata_colors=None, t_xcor_seq=False, t_xcor_heatmap=False, matrix_type='identity', colormap='inferno')[source]
Update ete3 tree with XCoR info and attributes and return tree_style for further visualization.
Parameters
- tree_ete3ete3’s tree object,
as imported by io.load_tree_ete3()
annot_file : pandas dataframe of the annotation file
- xcor_idlist of XCoR sequence identifiers, as imported by io.load_msa()
the ids must match with the tree’s leaves id
- xcor_seqcorresponding list of xcor sequences to display,
as imported by io.load_msa()
- meta_datatuple of annotations to display
(from annotation file’s header)
- show_leaf_nameboolean, optional, default: True
whether to show leaf names.
- linewidthint, optional, default: 1
width of the lines in the tree
- linecolorstr, optional, default: “#000000”
color of the lines
- bootstrap_styledict, optional,
fgcolor: color of the bootstrap node, default: “darkred” size: size of the bootstrap node, default: 10 support: int between 0 and 100, minimum support level for display
- tree_scaleint, optional, default: 200
sets the scale of the tree in ETE3: the higher, the larger the tree will be (in width)
- metadata_colorsdict, str, or None, optional, default: None
- colors for the metadata:
None: generates automatically the colors
str: uses a Matplotlib colormap to generate the colors
- dict: specifies colors for each matadata entry
{key: color}
fig_title : figure title (str)
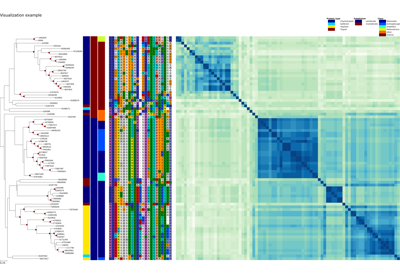
- t_xcor_seqboolean,
whether to show the sequences of the XCoR
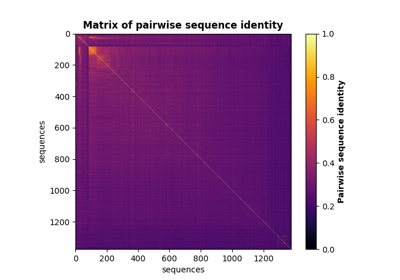
- t_xcor_heatmapboolean,
whether to add a heatmap of the identity or similarity matrix between XCoR sequences
- matrix_typestr, default=’identity’
whether to compute pairwise sequence identity (‘identity’), similarity (‘similarity’), or normalized similarity (‘norm_similarity’).
- colormapstr, default=’inferno’
the matplotlib colormap to use for the heatmap
Returns
tree_style : TreeStyle class from ete3
- column_endint, the number of columns after the tree. If you want to
plot anything else alongside the tree, the column number should be equal to this value.
Examples using cocoatree.visualization.update_tree_ete3_and_return_style
Perform full SCA analysis on the S1A serine protease dataset
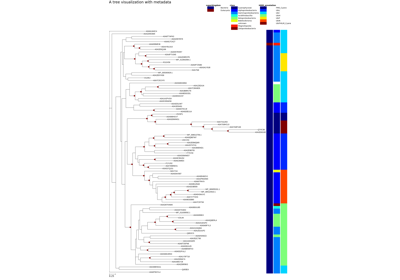
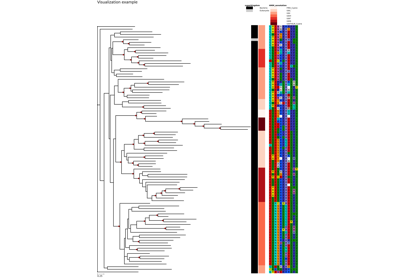
Plot XCoR together with (phylogenetic) tree and metadata
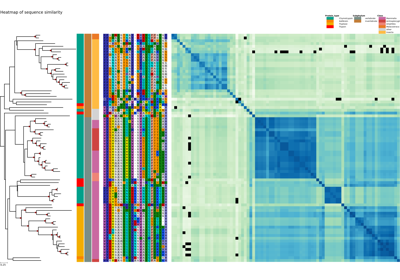
Plot a similarity heatmap of a XCoR along the phylogenetic tree